IVIS Project 3
Demo: http://www.csc.kth.se/~evertla/IVIS15/lab3/
Interpretation of data:
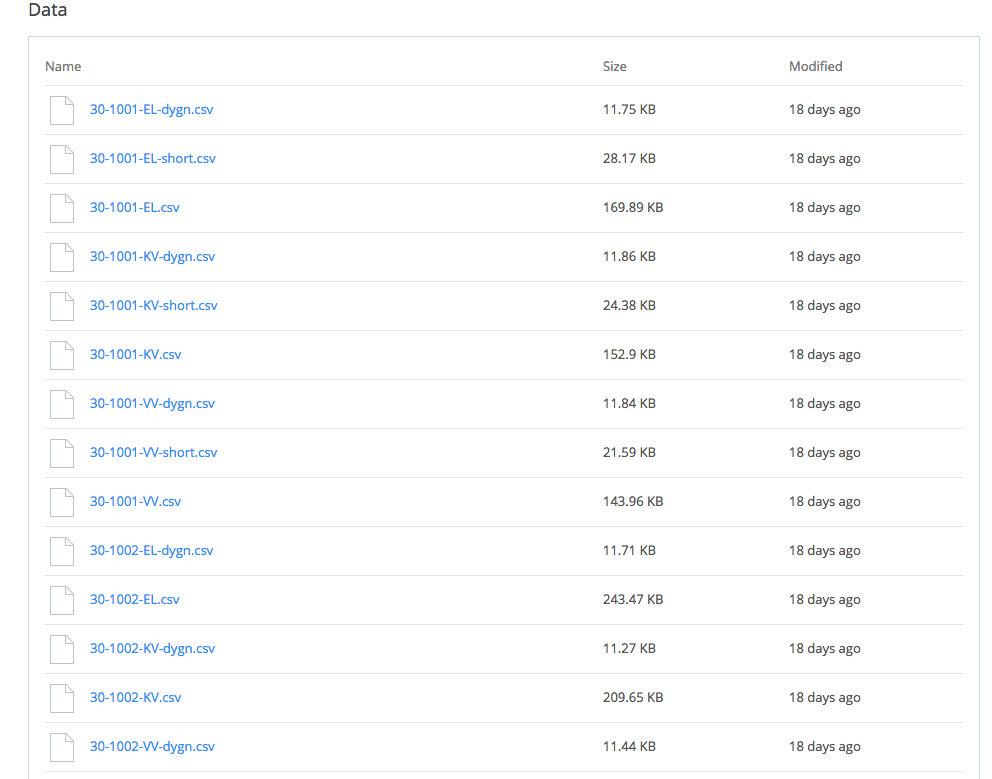
- 30-1001 = Home 1, 30-1002 = Home 2
- El/KV/VV = A running measurement tool that at each hour marks the consumed energy(electricity, cold water and hot water) and then resets to zero.
- El-dygn = Sum of electricity consumed during 24 hours.
- For each date in data we have two levels of detail(per day and per hour). We don’t always have both of them, sometimes we have neither.
Visual Mappings
The structure and characteristics (and lack of) data does not allow us to use exactly the visual mappings of the Boston Flickr project. However we can interpret the adjectives they have given us and create something that at first glance looks similar to that project but really is quite different. Sometimes in interaction design, you have to be creative in how to persuade clients :)
 | ||
| Low-fi-prototype: From the Boston Flickr project I kept the circular shape and the use of colors and color intensity. The inner ring represents cold water, the middle ring hot water and the outer ring electricity. The intensity of the color shows high and low periods of consumption. Important!: The color codes where later changed! |
  |
It feels natural that cold water should be represented with blue and hot water with red. Electricity cold be yellow or ice blue, but yellow looked ugly and blue was already taken. I chose purple.
|
Adding live data
 |
| I liked their metaphor for a dashboard for a driving car given by the client |
I am aware of the problems of rebound effects in persuasive ICT which aims to lower consumption. As argued by Owen (2011) the only effective method of reducing the energy consumption of any system is by the users continuous intent to use less energy. So I wanted to create a visualisation that would inspire the user to always try to lower their energy consumption in comparison with the relevant season of last year.
High-fi-prototype:
 |
| Blue = cold water, Red = hot water, Purple = Electricity |
Imagine that we are in looking at the visualisation on Sunday 7 march 2015. The visualisation shows a typical Sunday in March from last year. What this really means is that each hour has been calculated as an average of that hour for every Sunday in march 2014.
On the right side, we see the streaming live data of energy consumption in the home today. (I made a animation that fast forwards so that one hour is about 1 second but the idea is that the visualisation is updated each hour) Live data has been simulated to produce a randomised by believable output on the same color scale as the 2014 data. The user can compare her consumption today with relevant data from last year – in real time!
By choosing "History" in the menu, she can also access a full visualisation of last year, per month, week or day to analyse her patterns and be more aware of her ecological footprint.
